T cell polyfunctionality analysis
 |
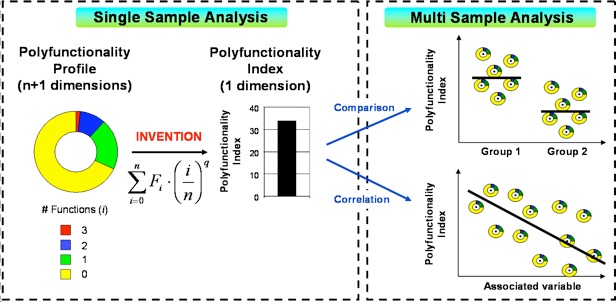
| Flow Cytometric analysis enables the evaluation of multiple parameters at the single-cell level. The frequency of cells positive for a particular parameter is analyzed by classic mono-parametric analysis. Repeating this analysis for n parameters (n=3 in this example) it is subsequently possible to auto-generate so-called boolean gates, representing all combinations (2^n = 8 (for n-3)) of parameters. To reduce complexity many studies analyze the frequence of cells positive for 0, 1 .... n simultaneous parameters presented in pie or doughnut diagrams. Funky Cells propose means to quantify polyfunctionality by further reducing these data to one single value taking into account all the combinatorial cell phenotypes. Quantification enables a better evaluation of sample diversity and allows classic statistical tests to be performed on polyfunctionality data, such as group comparison, correlations, cluster analysis etc. |
Functional evaluation of naturally occurring or vaccination-induced T cell responses in mouse, men and monkeys has in recent years advanced from single-parameter (e.g. IFN-γ-secretion) to much more complex multidimensional measurements. Co-secretion of multiple functional molecules (such as cytokines and chemokines) at the single-cell level is now measurable due primarily to major advances in multiparametric flow cytometry. The very extensive and complex datasets generated by this technology raise the demand for proper analytical tools that enable the analysis of combinatorial functional properties of T cells, hence polyfunctionality. Presently, multidimensional functional measures are analysed either by evaluating all combinations of parameters individually or by summing frequencies of combinations that include the same number of simultaneous functions. Often these evaluations are visualized as pie or doughnut charts. Whereas such charts effectively represent and compare average polyfunctionality profiles of particular T cell subsets or patient groups, they do not document the degree or variation of polyfunctionality within a group nor does it allow more sophisticated statistical analysis. Funky Cells proposes a software solution to make use of the patented technology (Larsen et al. PLoS One 2012) - the Polyfunctionality Index. The algorithm numerically evaluates the degree and variation of polyfuntionality, and enable comparative and correlative parametric and non-parametric statistical tests. Moreover, it allows the usage of more advanced statistical approaches, such as cluster analysis and prediction models (Boyd et al. PLoS One 2015). We believe that the polyfunctionality index will render polyfunctionality an appropriate end-point measure in future studies of T cell responsiveness.
Kind regards
Team Funky Cells
